DMSPC/BTAD
1. Organizational Overview
A. DMSPC - BTAD - Analytics and Project Management Service - Analytics Section - Data Science Team
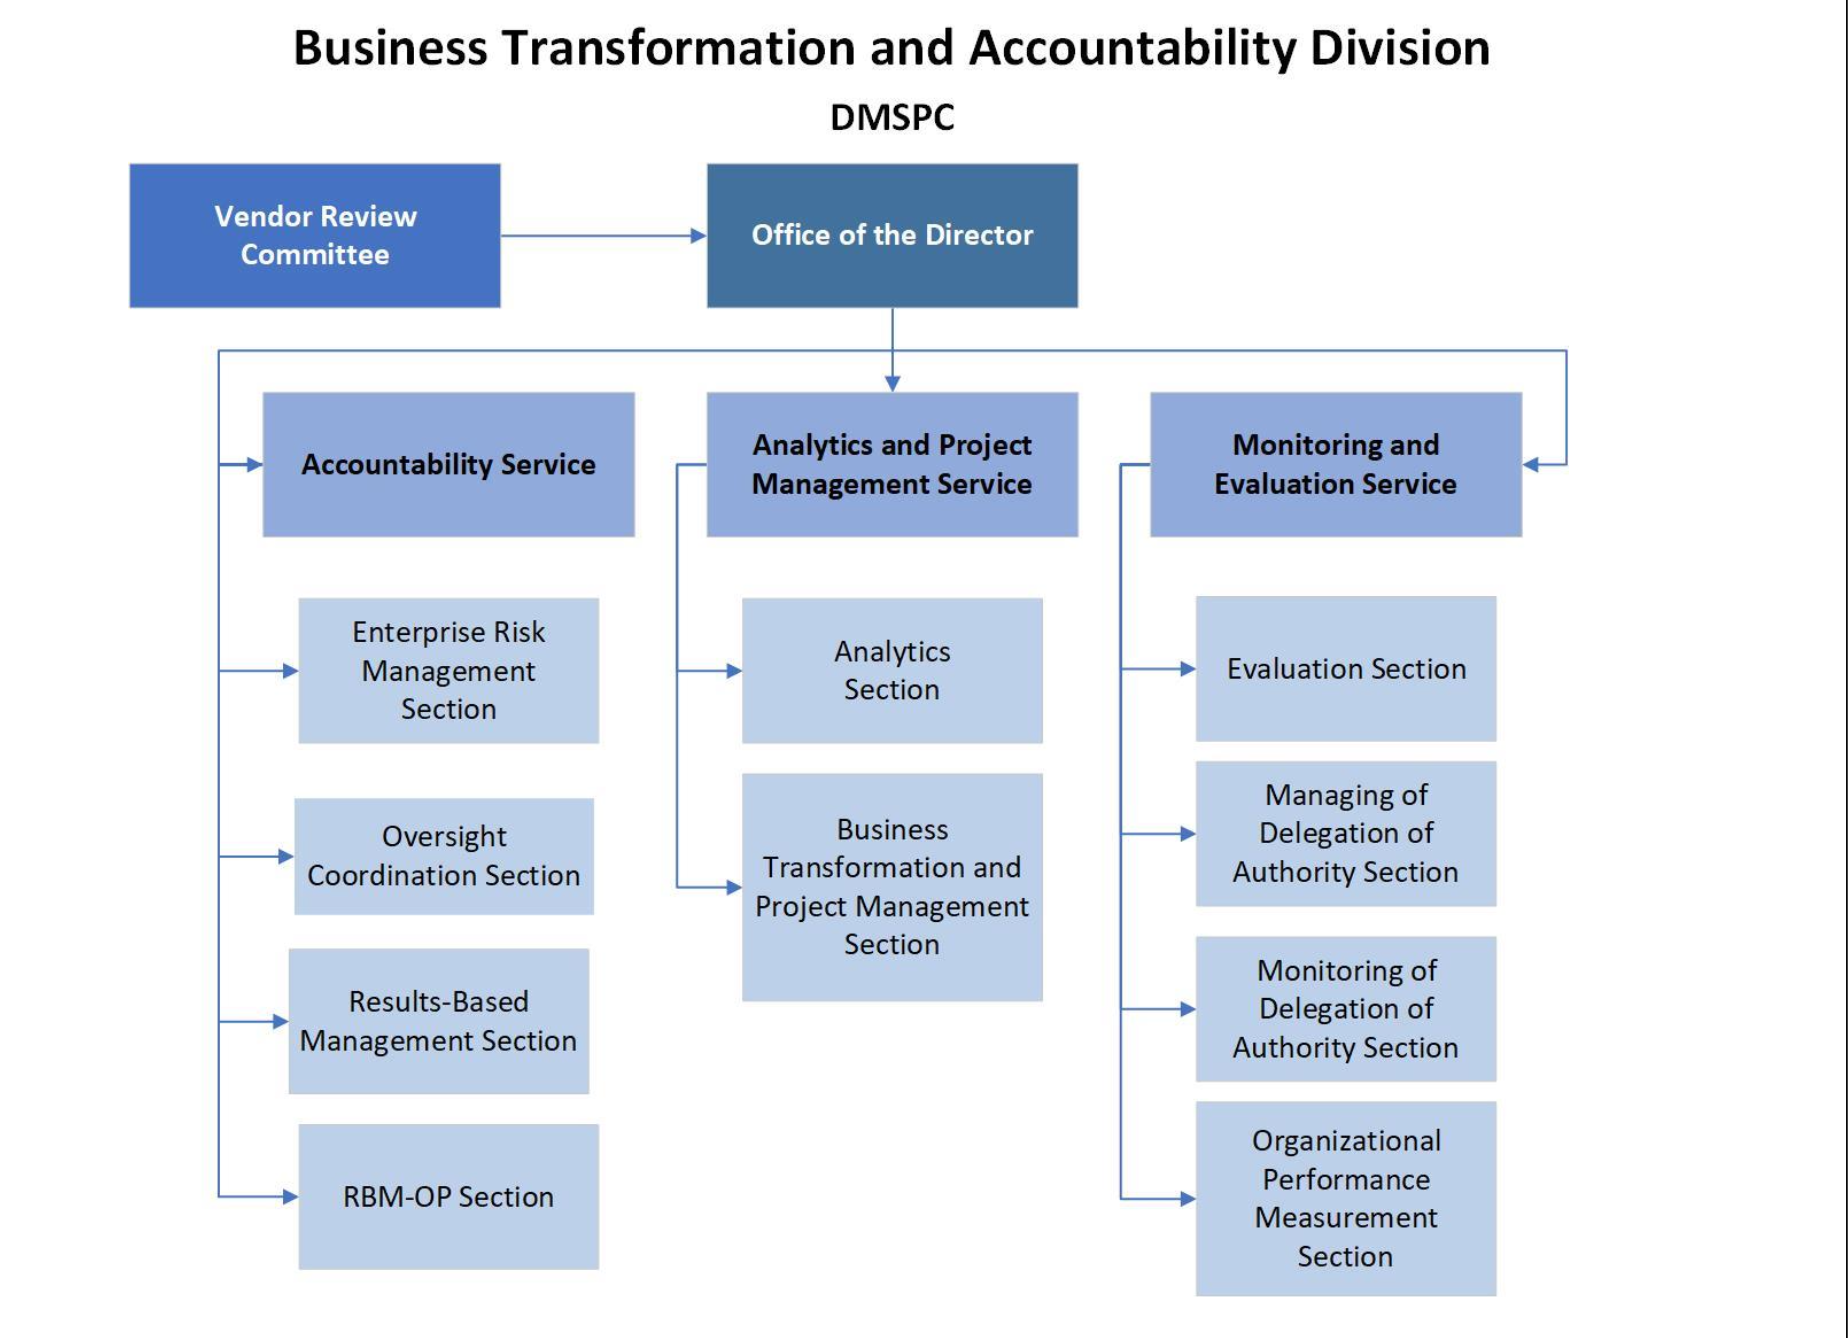
The Business Transformation and Accountability Division (BTAD) was introduced in January 2019 as part of the Secretary-General’s Management Reform. The purpose of this division is to house, in one entity, for the first time, specialized capacity for all the functions dedicated to monitoring and strengthening performance and accountability. Central to BTAD is the delegation of authority framework which was introduced with the management reform, and other areas are working on topics such as Enterprise Risk Management, Results-based Management, Evaluation and other areas thematically grouped around Accountability. The Analytics and Project Management Service is an important organizational unit within BTAD, focusing on business transformation, innovation, data analytics, and organizational change. The priorities of the Analytics Section are developing innovative data products and increasing data analytics capacity and capabilities in the Organization. Our data products aim to be innovative initiatives to find creative ways to use data to enable informed decision-making and identify innovative ways to better measure impacts and results.
Duties, Responsibilities and Output Expectations
Within delegated authority, the Junior Professional Officer will be responsible for the following duties:
- Supports major transformation, innovation, and analytics activities within the Service and assists in the projects in exploration, identification, and acquisition of data and information sources to determine their suitability for use.
- Enables applying quality methods to structure, format, standardize, and visualize data and information for analytical use for decision-making and advancing the goals of the organization, whether on the global Secretariat scale or for a specific area.
- Establishes a close working relationship with key clients to leverage the use of data science methods to support their programmatic areas with solutions that assist them in accomplishing their mandates.
- Contributes to the design and develops data science products to reveal insights and provides an understanding or knowledge of the data that would otherwise not be detected without the application of advanced analytical methods such as artificial intelligence, machine learning, predictive analytics, data and text mining, natural language processing, statistics, and use of relevant algorithms and computational approaches.
- Assists in promoting the use of data science solutions through client training and the development of products, tools and processes to extend the capabilities of client offices.
- Contributes to the design and develops customized visualization and presentation products to reveal the findings of analysis for clients, suitable for all forms of production including briefings, reports, interactive interfaces, and publication quality outputs.
- Guides, trains and supervises general service staff in the function, as needed.
- Perform other duties as required. Work implies frequent interaction with the following:
- Colleagues in the Analytics Section and across the Service.
- Clients within the UN Secretariat or the UN system.
Results Expected: Supports the development and delivery of business transformation initiatives aligned with the UN2.0 vision. Develops and delivers data science solutions to better enable the planning, decision-making, and implementation of organization programmes. Through close relationships with clients in a consultative way, designs products that provide insights, and predictive assessment to guide programme management and execution. Contributes to identifying significant issues and opportunities to implement innovative approaches and evidence-based reasoning to complex organizational issues.
B. Introduction to DMSPC and BTAD
The Department of Management Strategy, Policy and Compliance (DMSPC) is part of the UN Secretariat. It is tasked with developing management strategy, policies, compliance and oversight across administrative functions of the Secretariat. The Business Transformation and Accountability Division (BTAD) is a division within DMSPC focused on modernization, accountability, and internal transformation.
C. Functions of DMSPC
- DMSPC oversees administrative policy development, management strategy, quality assurance, and compliance functions within the Secretariat. (International Peace Institute)
- It integrates functions previously residing in older management or field support departments under one roof. (International Peace Institute)
- DMSPC sets the frameworks for accountability, performance, oversight, and risk management. (Unevaluation)
D. Role and Mandate of BTAD
BTAD (Business Transformation and Accountability) plays a central role within DMSPC. Its mandate includes:
- Leading business transformation efforts: rethinking how internal processes operate, introducing new models of work, and recommending change. (reform.un.org)
- Ensuring accountability systems are mainstreamed, such as Results-based Management (RBM), enterprise risk management, oversight coordination, and performance reporting. (reform.un.org)
- Coordinating major transformation and change-management projects across the Secretariat. (reform.un.org)
- Providing analytics and project management services: collecting, processing, analyzing business data (e.g. from Umoja, Inspira), producing dashboards, trend analyses, and analytical reports for internal and stakeholder use. (reform.un.org)
- Monitoring and evaluation: helping to assess programme / project performance, administering manager compacts, and monitoring delegated authority usage. (reform.un.org)
E. Examples of BTAD / BTAD-supported Outputs
- Data analytics dashboards for RSCE (Regional Service Centre Entebbe) were rolled out as part of BTAD’s collaboration with RSCE. (rsce.unmissions.org)
- Secretariat dashboards are being enhanced to include workforce data and Member States’ contribution information. (United Nations)
- BTAD publicly cites that it analyzes data from Umoja and Inspira for trends and business process diagnostics, producing reports and dashboards for relevant stakeholders including Member States. (reform.un.org)
- As part of transformation work with RSCE, BTAD also introduced other service offerings such as Propeller (a transformation methodology), Transformers Programme for culture change, NewWork network, and digital transformation support. (rsce.unmissions.org)
F. Programmes
Here is what I found on Propeller, Transformers Programme, NewWork network, and related BTAD transformation / change offerings in relation to RSCE and UN BTAD more broadly — along with caveats about what is publicly documented vs inferred.
G. Summary of Programs / Services
Below is a summary of each program / offering, based on available sources:
| Program / Offering | Purpose / Role | Key Features & Evidence | Notes / Gaps |
|---|---|---|---|
| Propeller (transformation methodology) | A structured business transformation framework to help entities translate vision into action under UN 2.0 | The Propeller service is explicitly listed among BTAD offerings to RSCE. It supports UN 2.0 implementation via human-centered design, inclusive engagement, and change management. (RSCE) Propeller is described in UNICEF “Change Management” materials as a method to help UN entities and teams envision the future, map strategy, and lead transformation. (knowledge.unicef.org) |
Public information gives general method descriptions, but not detailed internal BTAD use cases or metrics of success |
| Transformers Programme | Culture change / team practices programme | In the RSCE/BTAD project description, the “Transformers Programme for organizational culture change” is listed among the services introduced. (RSCE) The UN “Transformers” page describes it as a programme to help teams “cultivate engaging practices and habits for their teams and their clients.” (United Nations) |
The details on how BTAD applies the programme (modules, timelines, staff participation) are not publicly documented |
| NewWork network | Grassroots / internal network for new ways of working, innovation, collaboration | In the RSCE/BTAD narrative, “NewWork network” is included as an offered service. (RSCE) UN’s “What is NewWork” document describes that #NewWork is a network working toward more agile, innovative modes of work, experimenting with new working practices. (United Nations) |
The degree of formal structure, membership, or metrics within BTAD / UN Secretariat is not fully public |
| Digital transformation support | Assistance in deploying digital tools, process reengineering, and tech-enabled change | The RSCE/BTAD description includes “digital transformation” among ideation themes and lists “Digital transformation support” as one of the services. (RSCE) | There is less detail about specific digital initiatives (e.g. which systems, software, pilots) tied directly to BTAD’s support |
H. More Detail & Observations
1. Propeller
- Propeller is framed as a framework for business transformation that supports entities in envisioning future states, translating that into strategic priorities, and executing change. (knowledge.unicef.org)
- In the RSCE collaboration, BTAD positions Propeller as a service to support the entity in implementing the UN 2.0 agenda—i.e. aligning RSCE processes, culture, and capabilities with the transformation goals. (RSCE)
- The design principles for BTAD’s methodology (as implied in the RSCE description) are human-centered, inclusive / consultative, and responsive to stakeholder needs. (RSCE)
2. Transformers Programme
- The “Transformers Programme” is intended to drive organizational culture change, helping teams adopt new norms, work habits, and mindsets. (RSCE)
- On the UN “Transformers” site, the programme is described as helping teams adopt “engaging practices and habits … for their teams and their clients.” That suggests a focus on team dynamics, working methods, stakeholder collaboration. (United Nations)
3. NewWork Network
- NewWork is positioned as a network of UN employees experimenting with new work modalities, collaboration styles, and innovation practices. (United Nations)
- It is likely used as a community of practice, peer learning forum, and multiplier for culture change—allowing staff to pilot, share, and scale new working models. (United Nations)
- The inclusion of NewWork in BTAD’s service offerings suggests BTAD supports (or connects) the network to transformation projects.
4. Digital transformation support
- In the RSCE/BTAD project, one ideation theme in an “Ideation Café” was Digital Transformation, indicating that staff and stakeholders generated ideas around digital tools, automation, or tech-enabled process redesign. (RSCE)
- “Digital transformation support” is explicitly mentioned among the services that BTAD provides alongside analytics, Propeller, and other offerings. (RSCE)
- While not detailed in the source, this support likely includes advising on digital tools, designing digital workflows, helping pilot new tech (e.g. mobile tools, automation), and integrating digital systems.
2. Technical Overview
A. SQL Basics for Data Analysis
🧩 Core Syntax
-- Select columns
SELECT column1, column2
FROM table_name;

-- Filter rows
SELECT *
FROM employees
WHERE department = 'Finance' AND salary > 50000;

-- Sort results
SELECT name, salary
FROM employees
ORDER BY salary DESC;
🔍 Aggregations
-- Count, Average, Sum, Min, Max
SELECT department, COUNT(*) AS num_staff, AVG(salary) AS avg_salary
FROM employees
GROUP BY department;

-- Filter aggregated results
SELECT department, SUM(expense) AS total_expense
FROM budget
GROUP BY department
HAVING SUM(expense) > 100000;
🔗 Joins
-- Inner Join
SELECT e.name, d.department_name
FROM employees e
JOIN departments d ON e.department_id = d.id;

-- Left Join (keep all employees)
SELECT e.name, d.department_name
FROM employees e
LEFT JOIN departments d ON e.department_id = d.id;
🧮 Subqueries and Common Table Expressions (CTEs)
-- Subquery
SELECT name, salary
FROM employees
WHERE salary > (SELECT AVG(salary) FROM employees);

-- Common Table Expression (CTE)
WITH high_salary AS (
  SELECT * FROM employees WHERE salary > 100000
)
SELECT department, COUNT(*) FROM high_salary GROUP BY department;
🪄 Window Functions
-- Rank or calculate rolling metrics
SELECT
  name,
  department,
  salary,
  RANK() OVER (PARTITION BY department ORDER BY salary DESC) AS rank_in_dept
FROM employees;
🧰 Common SQL Functions
| Category | Examples |
|---|---|
| String | LOWER(), UPPER(), SUBSTR(), CONCAT() |
| Date | NOW(), DATE_TRUNC('month', date_col), EXTRACT(YEAR FROM date_col) |
| Math | ROUND(), ABS(), POWER(), LOG() |
| Conditional | CASE WHEN condition THEN x ELSE y END |
🐍 2. Python for Data Analysis (pandas, NumPy, matplotlib)
📦 Import and Load Data
import pandas as pd
import numpy as np
import matplotlib.pyplot as plt

df = pd.read_csv('data.csv')       # Load CSV
df.head()                          # Preview data
🔎 Inspect & Clean Data
df.info()            # Column types & nulls
df.describe()        # Summary stats
df.isnull().sum()    # Missing values
df['age'].fillna(df['age'].mean(), inplace=True)  # Fill missing
🧹 Filtering and Subsetting
df[df['country'] == 'Egypt']               # Filter rows
df[(df['age'] > 30) & (df['gender'] == 'F')]
df[['name', 'salary']]                     # Select columns
⚙️ GroupBy and Aggregation
df.groupby('department')['salary'].mean()
df.groupby(['region', 'year']).agg({'population': 'sum', 'gdp': 'mean'})
🔄 Merging & Joining (Like SQL Joins)
pd.merge(df1, df2, on='id', how='inner')      # Inner join
pd.merge(df1, df2, on='id', how='left')       # Left join
🧮 New Columns & Transformations
df['gdp_per_capita'] = df['gdp'] / df['population']
df['category'] = np.where(df['score'] > 0.8, 'High', 'Low')
📊 Visualization
# Histogram
df['salary'].hist(bins=20)
plt.xlabel('Salary')
plt.ylabel('Count')
plt.show()

# Scatter plot
plt.scatter(df['age'], df['income'])
plt.xlabel('Age')
plt.ylabel('Income')
🔢 Descriptive Stats & Correlation
df.corr()                      # Correlation matrix
df['salary'].mean()            # Average salary
df['age'].value_counts()       # Frequency table
🧠 Integrating SQL with Python
import sqlite3
conn = sqlite3.connect('data.db')

# Read SQL query into pandas DataFrame
query = "SELECT department, AVG(salary) AS avg_salary FROM employees GROUP BY department;"
df_sql = pd.read_sql_query(query, conn)
🧾 3. Example Workflow
Imagine you’re analyzing workforce data (like BTAD’s analytics section might do):
# Load HR data
df = pd.read_csv('workforce.csv')

# Clean and summarize
df['hire_date'] = pd.to_datetime(df['hire_date'])
df['years_service'] = (pd.Timestamp('today') - df['hire_date']).dt.days / 365

summary = df.groupby('department')['years_service'].agg(['mean', 'max', 'count'])
summary.reset_index(inplace=True)

# Visualize
summary.plot(kind='bar', x='department', y='mean', title='Average Years of Service by Department')
plt.show()
🧩 4. SQL ↔︎ Python Equivalents
| Task | SQL | pandas Equivalent |
|---|---|---|
| Select columns | SELECT name, age FROM people; |
df[['name', 'age']] |
| Filter rows | WHERE age > 30 |
df[df['age'] > 30] |
| Group & aggregate | GROUP BY country |
df.groupby('country').agg({'pop':'sum'}) |
| Join tables | JOIN ON id |
pd.merge(df1, df2, on='id') |
| Create column | SELECT salary * 12 AS annual |
df['annual'] = df['salary'] * 12 |
🧰 5. Common Packages for Data Science
| Category | Python Library | Description |
|---|---|---|
| Data manipulation | pandas, numpy |
DataFrames, arrays |
| Visualization | matplotlib, seaborn, plotly |
Static & interactive plots |
| Machine learning | scikit-learn, xgboost |
ML models, preprocessing |
| Databases | sqlite3, SQLAlchemy, psycopg2 |
SQL integration |
| Statistics | scipy.stats, statsmodels |
Statistical testing |
| Geospatial | geopandas, folium, shapely |
Spatial data analytics |
Perfect timing — here’s a clear, compact Git cheat sheet that’s especially useful for analysts, developers, or data scientists who need to track code, data, or notebooks (e.g., WHO/UN analytics projects).
It covers the core concepts, commands, and workflows that matter most.
🧠 Git Cheat Sheet for Analysts & Data Scientists
🧩 1. What is Git?
| Concept | Description |
|---|---|
| Git | A version control system that tracks changes in files and lets multiple people collaborate without overwriting each other’s work. |
| Repository (repo) | A directory tracked by Git — it contains your code, data, notebooks, and a hidden .git folder storing version history. |
| Commit | A snapshot of your project at a specific point in time. |
| Branch | A parallel line of development (e.g., feature branch vs main branch). |
| Remote | A copy of your repo stored on a server (e.g., GitHub, GitLab). |
🧭 2. Typical Workflow
[Local edits] → git add → git commit → git push → [Remote repo]and to update:
[Remote changes] → git pull → [Local repo]⚙️ 3. Basic Setup
# Set your identity (do this once)
git config --global user.name "Your Name"
git config --global user.email "your@email.org"

# Check settings
git config --list
📂 4. Start a New Repository
# Initialize in current folder
git init

# Clone an existing one
git clone https://github.com/username/repo.git
💾 5. Tracking Changes
# Check current status
git status

# Stage files for commit
git add file1.py file2.csv
git add .          # add all changed files

# Commit your changes
git commit -m "Add data cleaning script"

# Show history
git log --oneline
🌿 6. Working with Branches
# List branches
git branch

# Create a new branch
git branch feature/data-pipeline

# Switch to it
git checkout feature/data-pipeline

# Shortcut: create + switch
git checkout -b feature/data-pipeline

# Merge into main
git checkout main
git merge feature/data-pipeline
🔄 7. Sync with Remote Repository
# Link to a remote repository
git remote add origin https://github.com/username/repo.git

# Upload commits
git push origin main

# Download and merge updates
git pull origin main
🧰 8. Undo & Fix Mistakes
# Undo changes in a file (revert to last commit)
git checkout -- file.py

# Unstage a file
git reset HEAD file.py

# Amend the last commit message
git commit --amend -m "New commit message"

# See differences
git diff          # unstaged
git diff --staged # staged
🧹 9. Ignore Files
Create a .gitignore file:
# Ignore data files, environment, and outputs
*.csv
*.ipynb_checkpoints
.env
__pycache__/
📤 10. Forking and Pull Requests (GitHub)
| Step | Description |
|---|---|
| Fork | Copy someone else’s repo to your own GitHub account. |
| Clone | Download it locally. |
| Commit & Push | Make and push your changes to your fork. |
| Pull Request (PR) | Ask the original repo maintainer to merge your changes. |
🧩 11. Collaboration Tips
| Task | Command |
|---|---|
| Check who edited what | git blame filename |
| View history of a file | git log filename |
| Resolve merge conflicts | Edit conflict markers (<<<<, ====, >>>>), then git add + git commit |
| Fetch without merging | git fetch origin |
🧮 12. Visualization Tools
git log --graph --oneline --decorate→ See branch structure- VS Code Git panel → Visual staging / commit GUI
- GitHub Desktop / Sourcetree → GUI for non-terminal workflows
🗂️ 13. Common Patterns for Data Science
| Situation | Command |
|---|---|
| You edited notebooks or data locally | git add *.ipynb + git commit -m "update analysis" |
| You want to save models but not large data | add to .gitignore: data/, models/ |
| You need to sync your repo daily | git pull origin main before editing |
| You want to try new analysis safely | git checkout -b experiment1 |
🧱 14. Quick Reference
| Action | Command |
|---|---|
| Initialize repo | git init |
| Clone repo | git clone URL |
| Stage changes | git add . |
| Commit | git commit -m "message" |
| Push | git push origin main |
| Pull | git pull origin main |
| Create branch | git checkout -b name |
| Merge branch | git merge name |
| Show history | git log --oneline |
| Check status | git status |
3. Data Science Core Concepts
A. Clustering
Definition
Clustering is an unsupervised learning technique that automatically groups data points based on similarity — without pre-labeled categories.
Purpose
To discover hidden structures or patterns in data.
Example
Grouping countries by socioeconomic indicators (e.g., GDP, literacy rate, life expectancy).
Common Algorithms
- K-Means – partitions data into k groups minimizing within-group variance.
- Hierarchical Clustering – builds nested clusters (tree-like dendrogram).
- DBSCAN – identifies dense regions, useful for irregular shapes and noise.
Output
Each data point is assigned a cluster label, e.g., Cluster 1, Cluster 2, etc.
B. Classification
Definition
Classification is a supervised learning method where the algorithm learns from labeled examples to predict categorical outcomes.
Purpose
To assign new data points to predefined categories.
Example
- Predicting if an email is spam or not spam.
- Predicting if a patient’s test result is positive or negative.
Common Algorithms
- Logistic Regression (binary classification)
- Decision Trees / Random Forests
- Support Vector Machines (SVM)
- Neural Networks
Output
Discrete labels (e.g., “Yes/No”, “A/B/C”, “Spam/Not Spam”).
C. Correlation
Definition
Correlation measures the strength and direction of a linear relationship between two variables.
Purpose
To identify how variables move together — not to infer causation.
Metric
The correlation coefficient (r) ranges from:
- +1 → perfect positive relationship
- 0 → no linear relationship
- –1 → perfect negative relationship
Example
If income increases as education level increases → positive correlation.
Visualization
- Scatter plots
- Heatmaps (correlation matrices)
D. Dimension Reduction
Definition
Dimension reduction techniques reduce the number of variables (features) in a dataset while preserving as much information as possible.
Purpose
- Simplify models
- Reduce computation cost
- Mitigate overfitting
- Enable visualization of high-dimensional data
Common Methods
- PCA (Principal Component Analysis) – transforms correlated features into uncorrelated “principal components”.
- t-SNE / UMAP – nonlinear methods for visualizing complex data in 2D or 3D.
Example
Reducing 100 survey questions to 5 underlying “factors” (e.g., satisfaction, trust, stress).
E. Forecasting
Definition
Forecasting uses historical data to predict future values, often in time series contexts.
Purpose
To anticipate future trends or demand.
Example
Predicting future COVID-19 cases, or next month’s sales.
Common Techniques
- Statistical: ARIMA, Exponential Smoothing
- Machine Learning: LSTM networks, Random Forest Regressors
- Hybrid / Prophet (Meta) for flexible trend + seasonality modeling.
Key Components
- Trend – long-term movement
- Seasonality – regular repeating patterns
- Noise – random variation
F. Machine Learning (ML)
Definition
Machine Learning is a subset of Artificial Intelligence (AI) that enables systems to learn patterns from data and improve over time without explicit programming.
Categories
| Type | Description | Example |
|---|---|---|
| Supervised | Learn from labeled data | Classification, Regression |
| Unsupervised | Find patterns in unlabeled data | Clustering, Dimension Reduction |
| Semi-supervised | Mix of labeled and unlabeled data | Document labeling |
| Reinforcement | Learn through trial and feedback | Robotics, Game AI |
Workflow
- Collect and clean data
- Split into train/test sets
- Train model
- Evaluate accuracy
- Deploy and monitor
G. Detecting Outliers
Definition
Outlier detection identifies data points that deviate significantly from the majority of observations.
Purpose
To detect anomalies, errors, or rare events.
Example
- Unusually high credit card transaction (fraud).
- Abnormally high hospital stay length (data error or special case).
Techniques
- Statistical: Z-score, IQR (interquartile range)
- Model-based: Isolation Forest, One-Class SVM, DBSCAN
- Visualization: Boxplot, Scatter plot
Typical Rule (IQR method)
If value < Q1 − 1.5×IQR or > Q3 + 1.5×IQR → outlier
H. Regression
Definition
Regression is a supervised learning method for predicting continuous numeric values based on one or more predictors.
Purpose
To model relationships and estimate the impact of one variable on another.
Example
Predicting:
- House prices (based on area, rooms, location)
- Life expectancy (based on income, health spending)
Common Algorithms
- Linear Regression – assumes linear relationship
- Polynomial Regression – models curves
- Regularized models (Ridge, Lasso) – reduce overfitting
- Tree-based regressors – Random Forest, Gradient Boosting
Output
Continuous numeric predictions (e.g., 32.5, 100.2, etc.)
🧩 Summary Table
| Concept | Type | Output | Typical Use |
|---|---|---|---|
| Clustering | Unsupervised | Cluster labels | Group similar items |
| Classification | Supervised | Categories | Predict discrete classes |
| Correlation | Statistical | Coefficient (-1 to +1) | Measure linear association |
| Dimension Reduction | Unsupervised | Reduced feature set | Simplify data |
| Forecasting | Predictive | Future values | Time-based prediction |
| Machine Learning | Framework | Model | Automate learning |
| Outlier Detection | Statistical / ML | Flags | Detect anomalies |
| Regression | Supervised | Continuous values | Predict numeric targets |
4. PopEstimation Model
Excellent — you’re describing a multi-stage supervised machine-learning workflow for estimating population in refugee camps using satellite imagery. Let’s unpack what algorithms and techniques are being used, and how they connect to each stage of the project pipeline.
🧠 Overview
Goal: Estimate population counts in refugee camps (e.g., Ein Iss, Washokoni) from high-resolution satellite imagery.
Data Sources:
- WorldView-3 imagery (≈30 m NAT format) — used for training only
- UNHCR population statistics — ground truth for regression calibration
- Manually labeled masks (buildings, caravans, tents)
🧩 1️⃣ Problem Definition
Type: A supervised learning problem with two linked tasks:
| Task | Input | Output | ML Type |
|---|---|---|---|
| Segmentation | Satellite image | Mask showing object locations | Supervised, Image Segmentation |
| Population estimation | Counts of detected objects | Estimated population number | Supervised, Regression |
🧮 2️⃣ Algorithms Used
A. U-Net (Convolutional Neural Network for Image Segmentation)
- Purpose: Identify and segment buildings, tents, caravans from satellite images.
- Model Type: Deep learning CNN (Convolutional Neural Network) designed for semantic segmentation.
- Framework:
Keras(possibly using TensorFlow backend). - Input: 256 × 256 pixel tiles from satellite imagery.
- Output: Binary or multi-class mask images showing object boundaries.
Why U-Net?
- Well-suited for small datasets (compared to fully convolutional networks).
- Performs pixel-wise classification (every pixel → “tent”, “background”, etc.).
- Enables accurate extraction of features even from complex textures like sand, canvas, or rooftops.
Training Process:
- Labeling: Manual annotation of buildings/tents using masks.
- Augmentation: Artificially increase dataset size (rotation, flipping, brightness shifts).
- Loss function: Likely binary cross-entropy or Dice loss.
- Evaluation metrics: IoU (Intersection over Union), pixel accuracy.
B. Linear Regression (Population Estimation Model)
- Purpose: Estimate total population based on the number of detected shelters.
- Model Type: Classical regression algorithm (likely
LinearRegressionfromscikit-learn).
Input / Output
| Input | Output |
|---|---|
| Number of buildings, tents, caravans (from U-Net output) | Estimated population count |
Mathematical Form
[ = _0 + _1() + _2() + _3() + ]
- Training data: UNHCR’s verified population counts used as targets (labels).
- Evaluation metric: R² score or Mean Absolute Error (MAE) to measure prediction accuracy.
- Implementation:
scikit-learn(from sklearn.linear_model import LinearRegression).
C. Graphical User Interface (GUI)
Purpose: Enable non-technical users to:
- Train or retrain models interactively,
- Visualize segmentation outputs,
- Generate population estimates.
Implementation: Python GUI libraries such as Tkinter, PyQt5, or Streamlit.
Features: Model training trigger, file browser for input imagery, output visualization (masked images and numerical estimates).
⚙️ 3️⃣ Supporting Components
| Component | Function |
|---|---|
| Data Augmentation | Rotations, brightness shifts, flips to enrich training data and reduce overfitting |
| Labeling | Manual annotation of camps → creates ground-truth segmentation masks |
| Accuracy Metrics | IoU for segmentation; R² or MAE for regression |
| Dynamic Retraining | Interface allows retraining with new labeled data (continuous learning) |
| Visualization | Output includes masked overlays + tabular summaries of object counts |
🧩 4️⃣ Combined Workflow Summary
| Step | Process | Algorithm / Tool |
|---|---|---|
| 1 | Preprocess satellite imagery (tile into 256×256 patches) | Python, OpenCV, Rasterio |
| 2 | Label tents, buildings, caravans | Manual mask creation |
| 3 | Train segmentation model | U-Net CNN (Keras) |
| 4 | Generate segmentation masks on new images | Predict pixel classes |
| 5 | Count segmented objects | Connected component analysis |
| 6 | Predict population | Linear Regression (scikit-learn) |
| 7 | Display results | Python GUI (Tkinter / PyQt) |
📈 5️⃣ Current and Future Work
| Stage | Description |
|---|---|
| Current | Manual labeling of additional features to improve model accuracy and generalization. |
| Next steps | - Expand training data across more EMRO camps. - Explore transfer learning or advanced segmentation models (Mask R-CNN, DeepLab v3). - Integrate with cloud-based inference (e.g., AWS Sagemaker, TensorFlow Lite). |
🧠 6️⃣ Summary of Algorithms
| Function | Algorithm | Library |
|---|---|---|
| Image segmentation | U-Net CNN | Keras / TensorFlow |
| Population regression | Linear Regression | scikit-learn |
| Data augmentation | Image transforms | keras.preprocessing.image / albumentations |
| Mask labeling | Manual (supervised labels) | e.g., QGIS / LabelMe / CVAT |
| User interface | GUI tool for retraining | Tkinter / PyQt5 |
| Evaluation | Accuracy, IoU, R² | scikit-learn.metrics |
✅ In summary: This project combines deep learning (U-Net segmentation) with traditional machine learning (linear regression) in a supervised learning pipeline. It converts raw satellite imagery into quantitative indicators (shelter counts), which are then statistically linked to UNHCR population data — producing rapid, replicable population estimates for humanitarian response.